- 4192 Devonwood Way, Ashburn, Virginia, 20148
- Helpline: +1 (703) 665-3747
Association between Left Atrial Deformation and Brain Involvement in Patients with Anderson-Fabry Disease at Diagnosis
- Home
- Back to Journal
- Article Details
Abstract
Background: Anderson-Fabry disease (AFD) can induce central nervous system White Matter Lesions (WMLs), ischemia and stroke, and is associated with structural and functional cardiac abnormalities also involving Left Atrial (LA) function. We sought to evaluate the possible interrelations of LA structure and function impairment with the presence of WMLs in AFD patients.
Methods: 22 AFD patients and 22 controls, matched for age and sex, underwent an echo-Doppler exam including quantification of Peak Atrial Longitudinal Strain (PALS). AFD patients underwent also a 3-T brain magnetic resonance imaging with a visual quantification of WMLs by Fazekas’ Score (FS) on 3D FLAIR images. The overall score was calculated as the sum of deep WMLs and periventricular WMLs.
Results: AFD patients had significantly higher Left Ventricular (LV) Mass Index (LVMi) and relative wall thickness, and lower PALS compared to controls. Among AFD patients, 9 showed a FS=0, and 13 a FS >1. AFD patients with FS ≥1 showed lower PALS (29.4±6.7 vs. 37.2±3.9%, p=0.003) than those with FS=0, without difference in LA volume index and LVMi. In AFD patients, FS was inversely related to PALS (r=-0.49, p<0.0001), even after adjusting for LVMi (r=-0.43, p<0.05) but not to other echo parameters.
Conclusions: In the absence of significant alterations in LA size, AFD patients had lower PALS compared to controls. The inverse association between PALS and presence of WMLs indicates a possible parallel early involvement of heart and brain.
Keywords: Anderson Fabry disease, Echocardiography, Left atrial strain, White matter lesions, Fazekas’ score.
Introduction
Anderson-Fabry Disease (AFD) is a rare X-linked lysosomal storage disorder leading to severe multiorgan dysfunction and inducing premature death. The disease is due to mutation in a gene that encodes alpha-galactosidase A, a lysosomal enzyme [1], with subsequent accumulation of sphingolipids in the lysosomes of various tissues. In cardiomyocytes, the accumulation of sphingolipids causes inflammation, hypertrophy and interstitial fibrosis [2], occurring at the early disease stages, even in the absence of overt symptoms of organ failure. Patients frequently develop cardiac involvement, such as rhythm and conduction disturbances, progressive hypertrophic cardiomyopathy and both atrial and ventricular arrhythmias [3–5]. Since Atrial Fibrillation (AF) is a possible complication of AFD, possibly causing cerebral ischemic events, the assessment of left atrial (LA) structure and function should be part of the echocardiographic work-up in this clinical setting. Moreover, although transient brain ischemia and major stroke are the most paradigmatic sequelae of central nervous system involvement in AFD, non-specific periventricular and deep white matter lesions (WMLs) along with silent lacunar infarctions are far more common, arising also in asymptomatic or poorly symptomatic patients [6]. As in several other conditions, the presence of white matter hyperintensities, ischemic lacunae and/or prominent perivascular spaces are all suggestive of chronic small vessels disease. Limited subcortical infarcts might evolve both into lacunar cavities and white matter hyperintensity without apparent cavitation on T2w images [7]. At present time, the etiopathogenesis of these phenomena is still largely unclear, being only partially explained by Gb-3 accumulation within the endothelium [8]. Among different methods, assessing the extent of WMLs, Fazekas’ Score (FS), first proposed in 1987 [9], is one of the most used visual semi-quantitative scale to assess WML load by Magnetic Resonance Imaging (MRI). This scale distinguishes deep and periventricular white matter, assigning to each a grading depending on the size and confluence of the WMLs [10, 11].
Little is known about the interaction between LA features and brain involvement in AFD patients. To date, the assessment of LA size and function can be performed by combining standard echo measurements with speckle tracking derived Peak Atrial Longitudinal Strain (PALS), an accurate and reproducible indicator of LA deformation [12]. Worthy of note, reduced PALS has been demonstrated to be associated with AF recurrence in the general population, after ablation or cardioversion [13–14]. PALS has been also evaluated in AFD, it being reduced in comparison with healthy controls [15]. The present study aimed to evaluate possible association between LA structure and function and presence of WML assessed by FS in patients suffering from AFD.
Methods
Study Population
We enrolled 22 newly diagnosed and enzyme replacement therapy-naive patients affected by genetically confirmed AFD classical variant. The study was approved by the local Ethical Committee (protocol number 1233/19). We excluded all patients with relevant cardiac or central nervous system signs/symptoms, patents already under enzyme replacement therapy, patients with evidence of stroke at brain MRI, and patients with poor echocardiographic imaging. All patients had confirmed diagnosis of AFD: for all subjects the evaluation of a-GalA activity and the GLA gene test was performed using the Dried Blood Filter Paper test. In male patients, diagnosis was made by demonstration of a deficient activity of alfa-galactosidase in plasma; female patients were directly tested for possible mutations in GLA gene, and then evaluated for a-GalA activity when positive at genetic test. All AFD patients underwent a comprehensive evaluation of AFD target organs. This included clinical examination, 12 leads resting ECG and blood draw for routine biochemical determinations. Serum LysoGb3 levels were measured by highly sensitive electrospray ionization liquid chromatography tandem mass spectrometry [16] in a single laboratory (Centogene, Rostock, Germany, reference normal values ≤ 1.8ng/mL). Other laboratory values were measured using standard laboratory techniques of Federico II University hospital. Renal function was expressed as estimated glomerular filtration rate, calculated with the Chronic Kidney Disease Epidemiology Collaboration equation. The control group consisted of 22 age and gender-matched healthy volunteers. Clinical examination, 12-lead resting ECG, standard and advanced echocardiographic exam and brain MRI were acquired for each patient. All participants gave written informed consent to the procedures before entering the study.
Echocardiography
Echo Doppler Exams Were Performed By A Vivid E95 Ultrasound Machine (Horten, Norway) Equipped With A 2.5 Mhz Phased-Array Transducer According To The American Society Of Echocardiography (ASE) / European Association Of Cardiovascular Imaging (EACVI) Standardization [17]. Blood Pressure (BP) and Heart Rate Were Measured At The Beginning Of Each Echocardiographic Exam. The Quantitative Analysis Of The Left Ventricle, Including Left Ventricular (LV) Mass, Relative Wall Thickness And 2D Derived Ejection Fraction, Was Performed In Agreement Of 2015 ASE/EACVI Recommendations On Chamber Quantification [18]. LV Mass Was Normalized For Height Powered To 2.7 And LV Hypertrophy Defined As LV Mass Index (Lvmi) > 47 G/M2.7 In Women And > 50 G/M2.7 In Men [19]. LA Volume Was Calculated By Using Area-Length Method (Average Of 4- And 2-Chamber View) And Indexed For Body Surface Area [18]. Transmitral E/A Ratio, E Velocity Deceleration Time (DT), Pulsed Tissue Doppler of Septal And Lateral Annulus (Early Diastolic Velocity [E’]), Average E/E’ Ratio And Tricuspid Regurgitation (TR) Jet Peak Velocity Were Determined In Apical 4-Chamber View As Recommended [20]. The Determination Of Pulmonary Arterial Systolic Pressure Was Based On The TR Peak Velocity And Adding To That Right Atrial Pressure To The Estimated TR Retrograde Gradient. Right Atrial Pressure Was Estimated According To ASE Guidelines, Based On The Size Of The Inferior Vena Cava And The Degree Of Its Inspiratory Collapse During Normal Respirations [21]. All The Echo Doppler Measurements Were Averaged From Three Cardiac Cycles.
Speckle-tracking echocardiography acquisition and post-processing (EchoPAC, GE, USA) were performed in apical long-axis, 4-chamber, and 2-chamber views of the conventional 2D gray scale images with a stable ECG recording, according to standardized procedures of our laboratory [22, 23]. Global Longitudinal strain (GLS) was calculated by averaging all values of regional peak systolic by a semi-automatic 2D strain software [24]. LA strain was evaluated by 2D speckle tracking recording in the apical 4- and 2- chamber views [25]. LA endocardial border was manually traced, delineating a region of interest (ROI) which consists of 6 segments. After tracking, quality analysis was done by manual adjustment of the ROI, and the longitudinal strain curves generated by the software. LA peak longitudinal deformation (PALS), measured at the end of the reservoir phase, and LA contraction strain (PACS), obtained during LA systole, were determined as the average of regional LA measurements taken in apical 4- and 2-chamber views [24–26] (Figure 1).
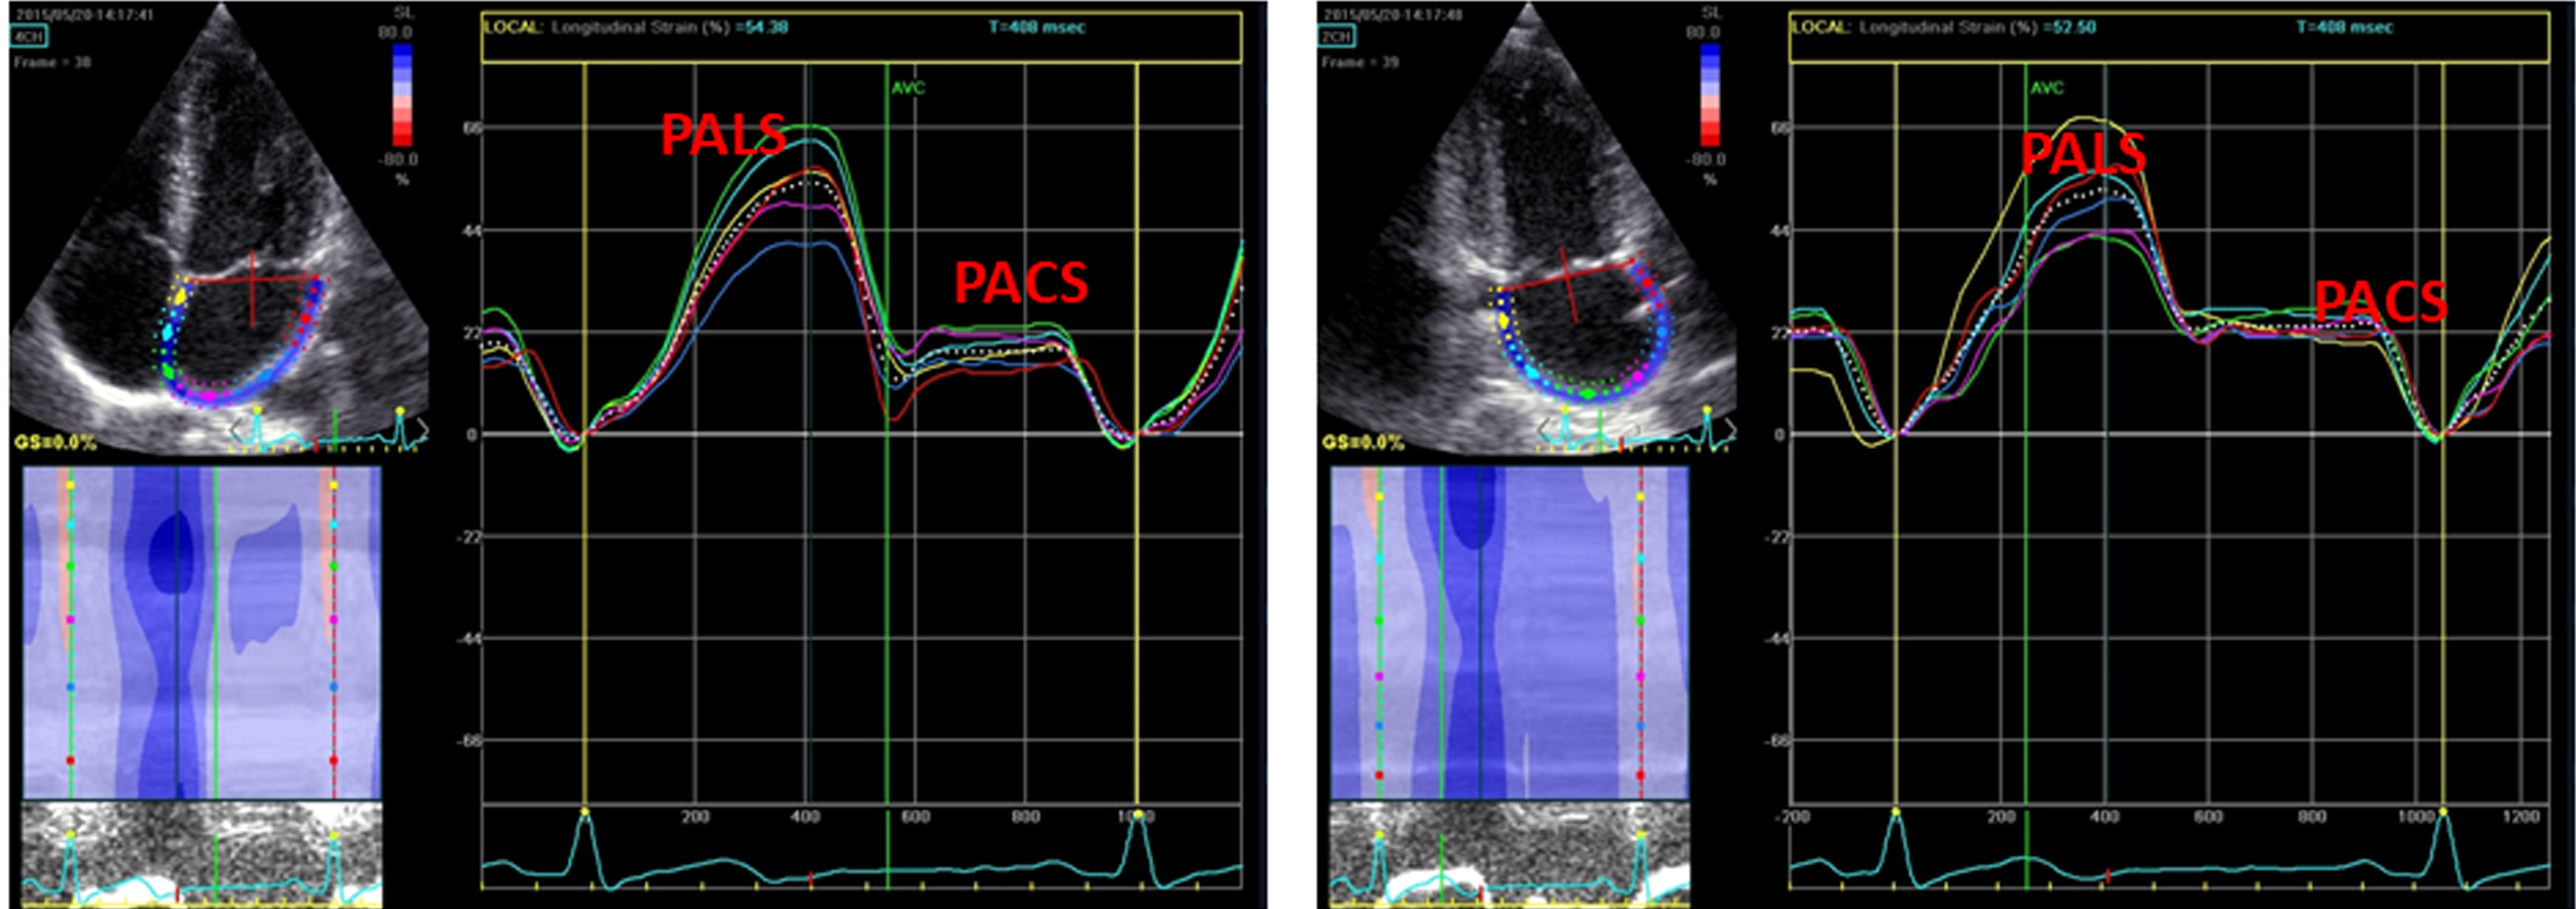
Figure 1: STE derived methodology to calculate LA strain in apical 4- and 2-chamber views.
Panel A: Apical 4-chamber view, Panel B: Apical 2-chamber view.
Brain MRI Data Acquisition and Interpretation
All AFD patients underwent brain MRI examination on the same 3T scanner (Trio, Siemens Medical Systems, Erlangen, Germany). The scanning protocol included a volumetric Fluid Attenuated Inversion Recovery (FLAIR) sequence to determine high signal intensity regions within normal white matter, along with an axial Diffusion Weighted Imaging (DWI) sequence to differentiate chronic hyperintense lesions from acute ischemic events. FS, used as indicator of small vessel impairment of central nervous system, was calculated by the agreement of two experienced neuroradiologists on the 3D FLAIR images according to the following scheme:
- deep white matter: 0) no WMLs; 1) punctate foci of hyperintensity; 2) beginning confluent WMLs; 3) large confluent WMLs;
- periventricular white matter: 0) no WMLs; 1) periventricular caps; 2) smooth periventricular “halo”; 3) irregular periventricular WMLs extending into deep white matter.
Small silent ischemic lacunae, when present, were considered as part of the white matter hyperintensity. The overall score was then calculated as the sum of the deep white matter and the periventricular white matter values [9, 27]. Figure 2 shows AFD patients with different degrees of white matter damage.
Statistical Analysis
Statistical analysis was performed by SPSS package, release 12 (SPSS Inc, Chicago, Illinois, USA). Data are presented as mean value ± SD. Descriptive statistics were obtained by one factor ANOVA and X2-distribution with computation of exact P value by Monte Carlo method. Univariate correlates of a given variable were evaluated by least squares linear regression. The null hypothesis was rejected at 2-tailed p<0.05.
Results
Standard and Speckle Tracking Echocardiography
The characteristics of the study population are reported in Table 1. The two groups were comparable for heart rate and BP, whereas body mass index was marginally higher in AFD patients (p<0.05). Table 2 shows standard echo-Doppler and STE analysis. As expected, LVMi and relative wall thickness were higher in AFD patients than in controls (p<0.002 and p<0.001 respectively). Six AFD patients (27%) presented clear-cut LV hypertrophy. Also GLS was reduced in AFD patients (p<0.01). The difference of LA volume index between the two groups did not achieve the statistical difference. PALS, but not PACS, was lower in AFD patients than in controls (p<0.0001).
Table 1: Characteristics of the study population.
|
Characteristics |
AFD |
Controls |
p-value |
|
Gender (M/F) |
14/8 |
14/8 |
1.00 |
|
Age (years) |
39.0 ± 14.6 |
39.1 ± 14.4 |
0.99 |
|
BMI (Kg/m2) |
26.1 ± 4.3 |
23.6 ± 2.5 |
<0.05 |
|
Systolic BP (mmHg) |
124.7 ± 17.8 |
118.4 ± 8.8 |
0.14 |
|
Diastolic BP (mmHg) |
76.7 ± 10.8 |
74.3 ± 6.9 |
0.37 |
|
HR (bpm) |
71.4 ± 9.8 |
73.2 ± 7.6 |
0.56 |
BMI = body mass index, BP = Blood pressure
Table 2: Echo-Doppler data of the study population.
|
Characteristics |
AFD |
Controls |
P value |
|
LVMi(g/m2.7) |
37.0 ± 12.5 |
27.0 ± 4.6 |
<0.002 |
|
RWT |
0.34 ± 0.6 |
0.29 ± 0.3 |
<0.001 |
|
LV EF (%) |
64.1 ± 3.8 |
62.6± 3.8 |
0.19 |
|
GLS (%) |
21.9± 1.9 |
23.3 ± 1.7 |
<0.01 |
|
Transmitral E/A ratio |
1.4 ± 0.44 |
1.3 ± 0.32 |
0.21 |
|
E velocity DT (msec) |
202.5± 44.5 |
202.1 ± 37.1 |
0.96 |
|
E’ velocity (cm/sec) |
0.78 ± 0.21 |
0.80 ± 0.21 |
0.64 |
|
E/e’ ratio |
6.4 ± 1.2 |
5.6 ± 1.1 |
0.22 |
|
PASP (mmHg) |
28.4 ± 6.2 |
26.2± 4.5 |
0.20 |
|
LAVi (ml/m2) |
29.3 ± 8.6 |
25.3 ± 5.3 |
0.07 |
|
PALS |
32.6 ± 6.9 |
42.2 ± 6.6 |
<0.0001 |
|
PACS |
13.7 ±3.7 |
16.3 ± 4.0 |
0.25 |
LVMi = left ventricular mass index, LV EF = Left ventricular ejection fraction, GLS = Global longitudinal strain, PASP = pulmonary artery systolic pressure, LAVi = Left atrial volume index, PALS = Peak atrial longitudinal strain, PACS = Peak atrial contraction longitudinal strain
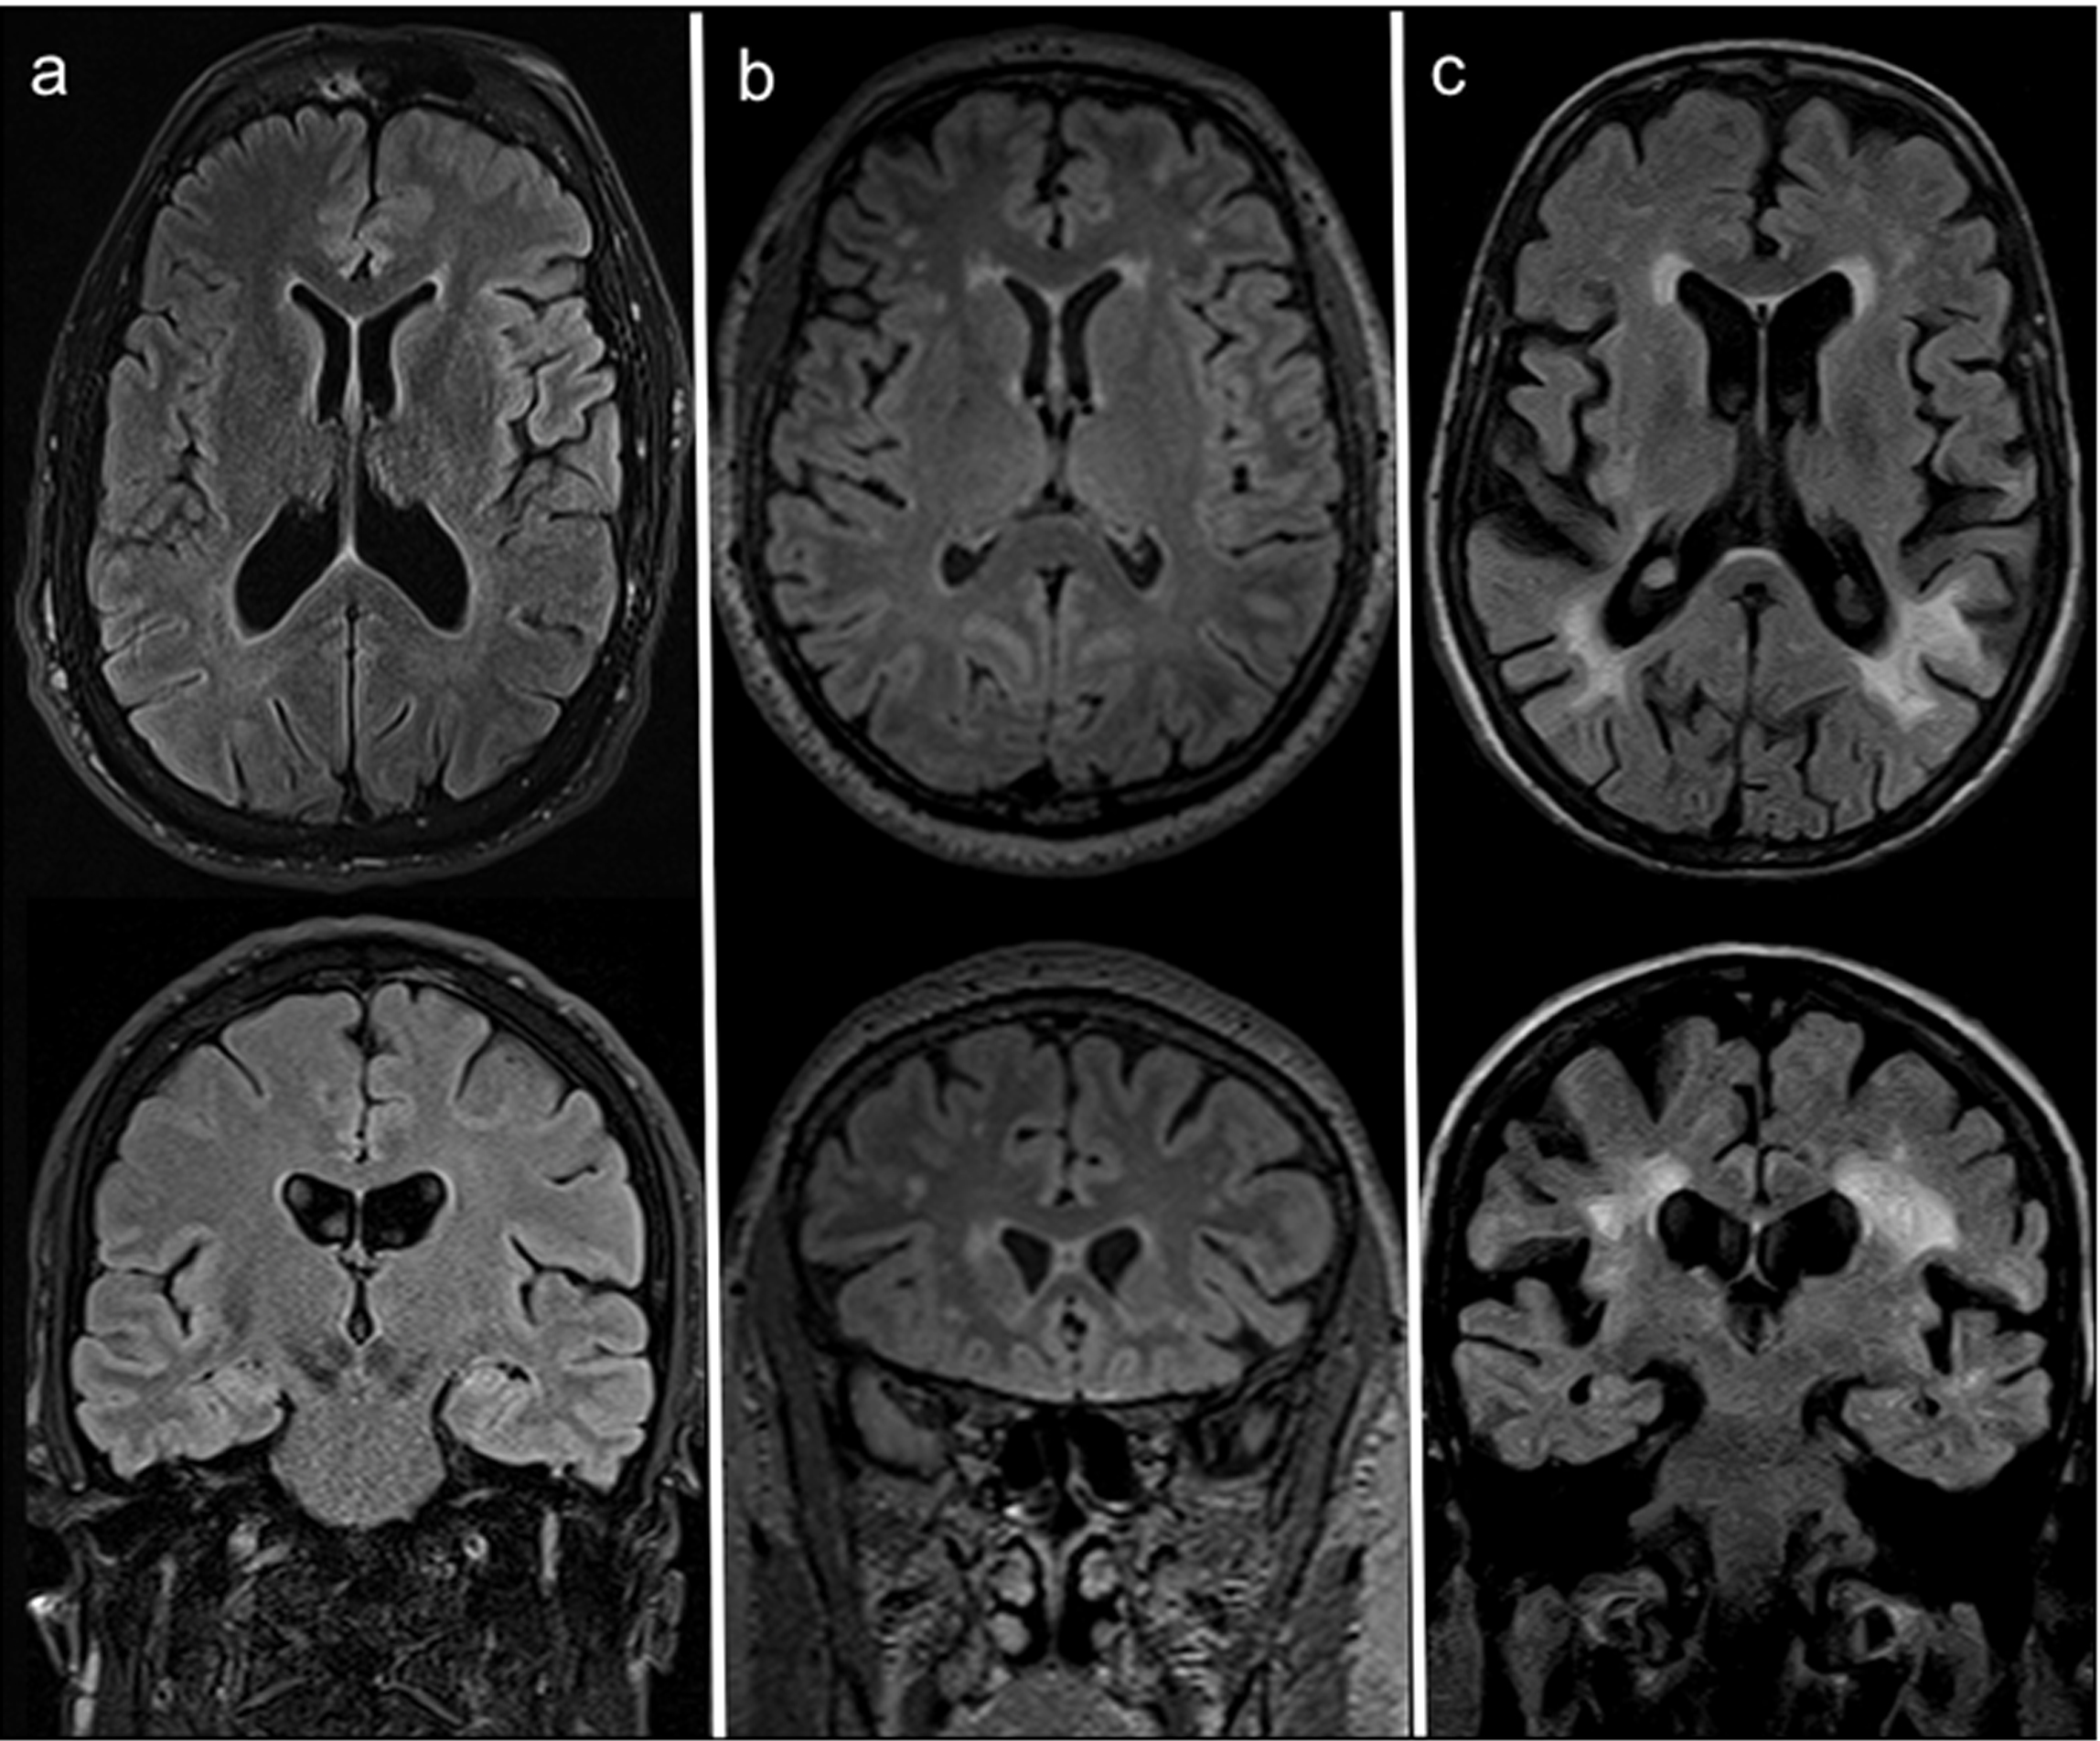
Figure 2: Axial (top) and coronal (bottom) FLAIR MRI at the most representative levels of three AFD patients with different degrees of white matter damage, respectively: (a) no WM involvement (52 years old woman with FS=0); (b) moderate WML load (44 years old male patients scoring a FS=3, with punctate foci of hyperintensity affecting the deep WM and smooth bilateral periventricular “halo”); (c) high WML load (59 years old man scoring FS=6, with largely confluent asymmetrical WMLs irregularly extending from periventricular to deep white matter and some scattered lacunar infarcts).
Brain MRI
Among the 22 AFD patients, WMLs were distributed as follows: 9 patients showed a FS=0, 9 a FS=1, 1 a FS=2, 1 a FS=3, 1 a FS=5 and 1 a FS=6, whereas none had a FS=4. Small silent ischemic lesions were evident only in 3 AFD patients, one with FS=0, one with FS=5 and one with FS=6. No sign of acute ischemic event was detected on DWI.
An example of AFD patient with white matter involvement on axial FLAIR MRI and reduced PALS is shown in Figure 3. By dividing AFD patients according to FS (<1 normal, ≥1 abnormal), the 13 patients with FS≥1 showed a lower PALS (p=0.0003) in comparison with FS<1, without significant difference of LA volume index (Table 3). The other echocardiographic measurements, including LVMi and GLS, did not differ significantly between the two subgroups (data not in Table):
Table 3: Echocardiographic measurements according to FS in AFD patients.
|
Variables |
FS≥1 (n= 13) |
FS<1 (n=9) |
p-value |
|
Age (years) |
43.3± 13.1 |
32.7± 10.3 |
0.09 |
|
LVMi (g/m2.7) |
40.5± 12.5 |
31.9± 4.6 |
0.12 |
|
LV EF (%) |
64.3 ± 03.5 |
63.6 ± 4.5 |
0.69 |
|
GLS (%) |
22.3 ± 2.1 |
21.1 ± 1.5 |
0.17 |
|
Transmitral E/A ratio |
1.5 ± 0.21 |
1.3 ± 0.54 |
0.14 |
|
E velocity DT (msec) |
187.3± 39.5 |
194.6 ± 55.5 |
0.70 |
|
E’ velocity (cm(sec) |
0.70 ± 1.5 |
0.78 ± 0.8 |
0.09 |
|
E/e’ ratio |
5.9 ± 1.1 |
5.1 ± 0.9 |
0.08 |
|
Relative wall thickness |
0.36 ± 0.6 |
0.32± 0.5 |
0.23 |
|
LAVi (ml/m2) |
31.4± 10.0 |
26.2± 5.2 |
0.17 |
|
PALS |
29.4±6.7 |
37.4± 3.9 |
0.0003 |
|
PACS |
13.9±2.8 |
13.5 ±4.2 |
0.80 |
FS = Fazekas Score
Other abbreviations as in Table 2
In the pooled AFD population FS was positively related with PALS (r=-0.49, p<0.0001) (Figure 4). This relation remained significant even after adjusting for LVMi (r=-0.43, p<0.05). FS was not significantly related with LVMi (r=0.29, p=0.148), relative wall thickness (r=0.25, p=0.23), ejection fraction (r=0.10, p=0.66), transmitral E/A ratio (r=0.11, p=0.62), E/e’ ratio (r=0.23, p=0.28), LAVi (r=0.10, p=0.68), and GLS (r=0.10, p=0.63). No correlation was found between FS and LysoGB3 and between PALS and LysoGB3.
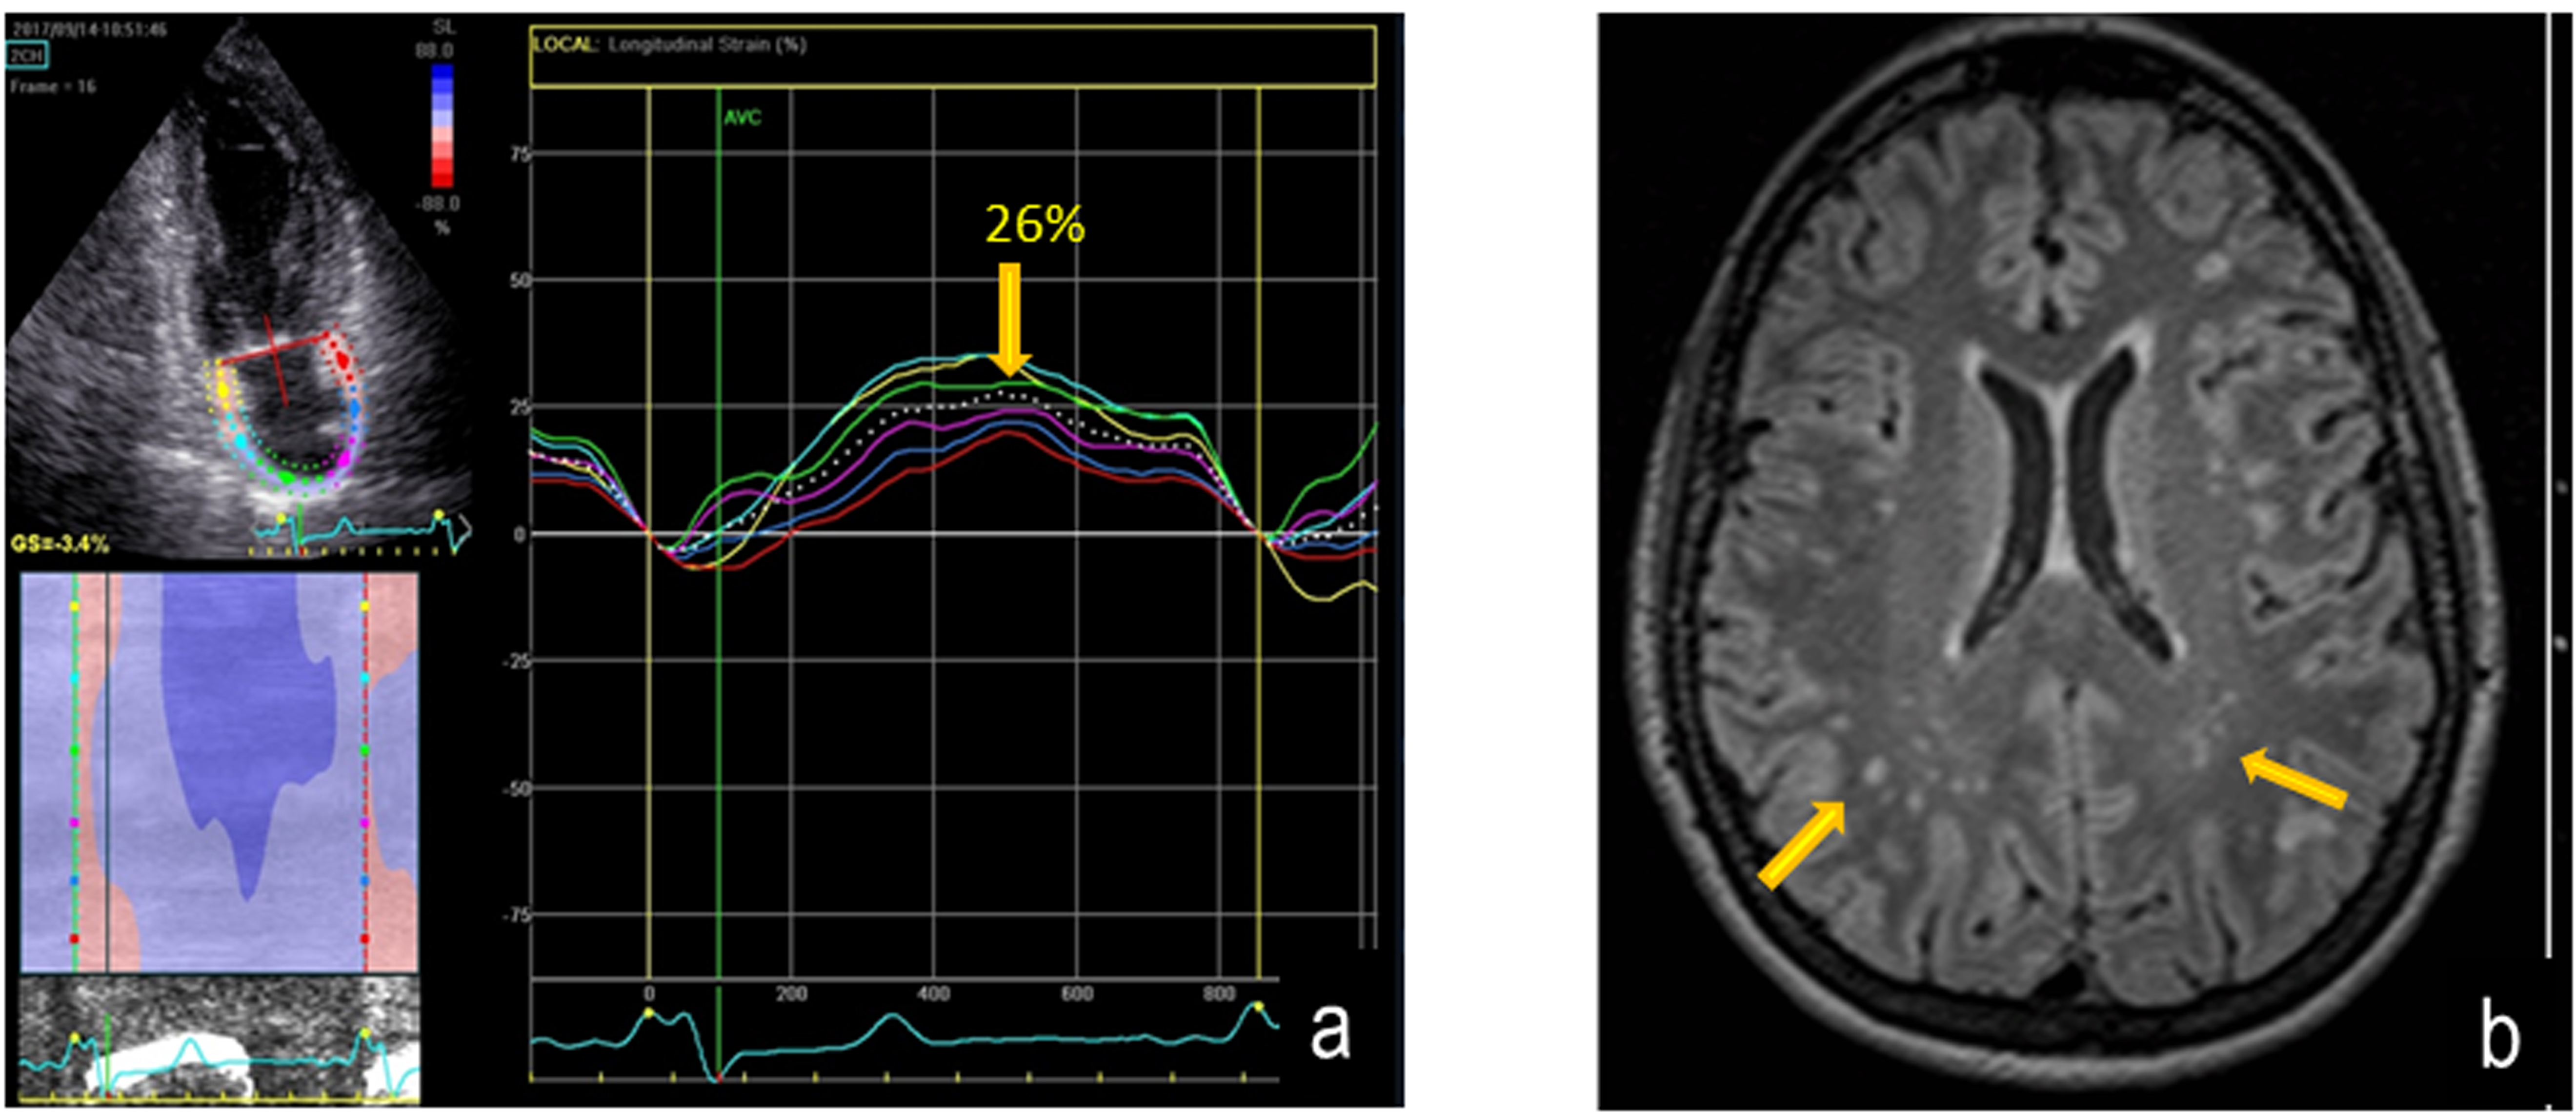
Figure 3: Reduction of PALS (left panel) and parallel axial FLAIR MRI image showing multiple white matter hyper intensities lesions (arrows) in a AFD patient. Fazekas score is = 1.
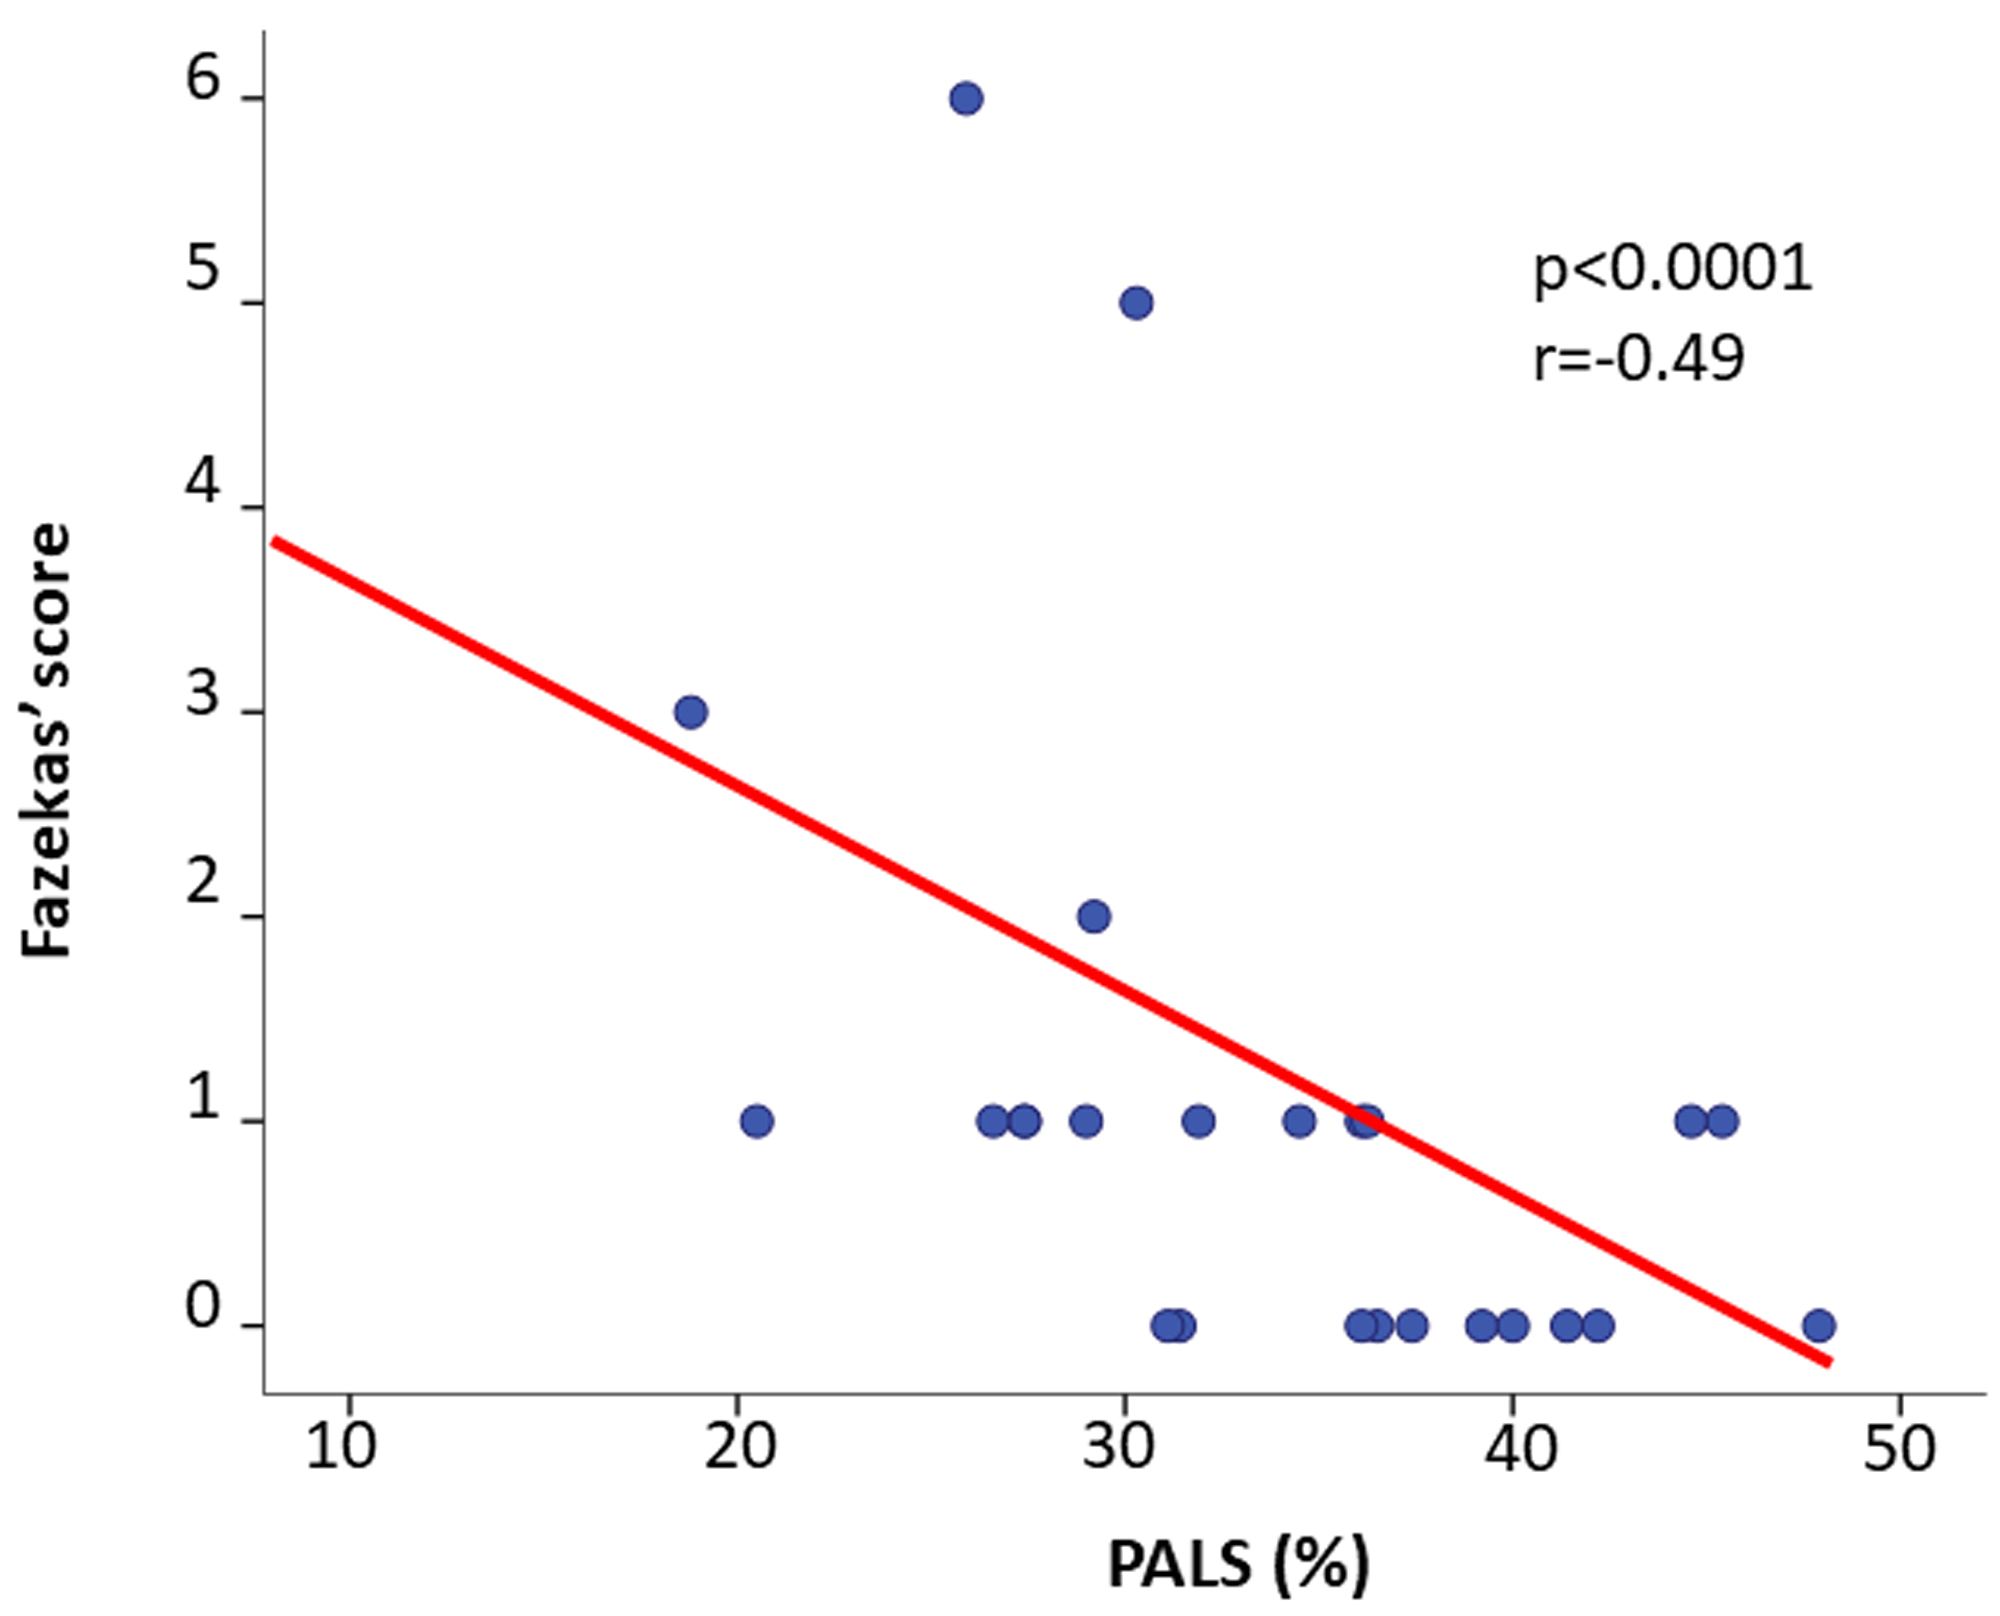
Figure 4: Scatterplot and regression line of the inverse relation between PALS and Fazekas Score in AFD patients.
Discussion
To the best of our knowledge, this is the first study to explore the relationships between LA function deterioration and brain involvement, i.e. presence and extension of WMLs evaluated through the FS, in AFD treatment-naïve patients. The present study demonstrates that (I) treatment-naive AFD patients at diagnosis show a significant reduction of GLS and PALS in comparison with healthy controls, whereas ejection fraction, PACS and LA volume index do not differ between the two groups; (II) patients with greater PALS impairment present a larger involvement of the central nervous system according to FS (≥1); (III) an inverse relation between PALS and FS is detectable in AFD patients.
Speckle tracking-derived LA strain is a relatively new parameter of LA function, whose reference normal values have been recently defined [28]. The ability of PALS in the early detection of LA function impairment is already known, it preceding changes in traditional two-dimensional measures of LA size [29]. Previous studies showed changes of LA structure and function, including a reduction of PALS in patients with AFD compared to healthy controls [15, 30, 31]. In the present study AFD patients did not exhibit significant differences in LA size, in contrast with a previous work showing a substantial LA dilation even in AFD without LV hypertrophy [30]. However, the evidence of LA dilation in AFD remains controversial, as in a cardiac MRI study LA volumes of the AFD group were similar to those seen in the healthy control group [32]. In our AFD patients, PALS, but not PACS, was substantially lower than in healthy controls. PALS and PACS have different physiopathologic meanings, since PALS represents LA reservoir function, depending also on LA compliance, whereas PACS corresponds to LA systole. In the general population, reduced LA compliance, as assessed by PALS impairment, is related to the extent of LA remodelling [14, 33]. It is conceivable that the early impairment of LA reservoir function and compliance in AFD could be attributable to the accumulation of glycosphingolipidsin LA tissue, which was already observed by myocardial biopsy and may be also responsible of lone atrial fibrillation onset [34].
MRI derived WMLs of the brain, often unexpectedly observed even in the normal population, can be evaluated by visual semi-quantitative scoring such as the FS [9–11]. This can be applied to images of variables quality and different scanners, with the advantage of including not only the abnormality extension but also the lesion location and texture. In AFD patients, the brain alteration, typically sparing midline or infra-tentorial structures [35], is mainly due to cerebral micro-vessel involvement and endothelial dysfunction own of the disease [36–38]. Brain alteration is also associated both to a progressive subtle glycosphingolipid accumulation in blood vessels wall and to the possible ischemic areas due to thromboembolic events in patients experiencing AF [39]. Notably, AFD-induced brain abnormalities have been found to be associated with an increased risk of stroke in absence of focal neurological symptoms [40]. In the present study, a variable degree of FS was observed in AFD patients since 9 showed a FS=0 and 13 had FS≥1, whereas no sign of acute ischemic event was detected on DWI.
It is worthy of note that PALS was the only echocardiographic variable able to differentiate AFD patients according to FS, it being substantially reduced in those with higher score. PALS reduction was evident in AFD patients who also had greater progression of brain disease in terms of WMLs as evidenced by FS. In addition, a significant inverse correlation between PALS and FS was observed: the greater PALS impairment the higher FS. No other echo parameter was related to FS. Although it is impossible to establish a certain cause-effect mechanism between these two findings, this association can at least be partially explained by a simultaneous accumulation of glycosphingolipids in both LA and brain districts, as part of multi-organ involvement own of the disease.
Study Limitations
Although easy to assess, FS is not completely reliable in relation with its subjective interpretation and consequent suboptimal intra-observer reproducibility [11]. Moreover, although chronic small vessel ischemia represents the most common cause, FS is unable to distinguish from other underlying mechanisms (demyelination and gliosis) possibly inducing WMLs. It also failed to distinguish AFD patients from non-AFD acute cerebrovascular events patients [27]. However, in the present study diagnosis of AFD was done by demonstration of a deficient activity of alfa-galactosidase in plasma for men, and by genetic analysis in women.
Clinical Implications
Our results confirm the concept that PALS may be considered an early predictor of target organ damage in AFD patients [15, 30, 31]. On the grounds of the significant association found in the present study between PALS reduction and FS scoring, it is conceivable that AFD patients with PALS abnormalities could be addressed to the performance of brain MRI in order to detect parallel involvement of white matter and initiate a very early enzyme replacement therapy, in agreement with the European Fabry Working Group recommendations [41, 42]. This kind of therapy has in fact demonstrated to exert a protective effect on central nervous system, by reducing the stroke risk and stabilizing WMLs progression [43] and could be therefore promoted in AFD patients with LA strain dysfunction.
Acknowledgement
- On behalf of the Anderson-Fabry Federico II Naples, ITalY (AFFINIITY) Group
This paper is dedicated to the memory of Maurizio Galderisi
Maria Lembo, Regina Sorrentino and Ciro Santoro are supported by CardioPaTh (International Program in Cardiovascular Pathophysiology and Therapeutics).
References
- Desnick RJ, Ioannou YA, Eng CM. a-Galactosidase A deficiency: Fabry disease. In: Scriver CR, Beaudet AL, Sly WS, Valle D, editors. The metabolic and molecular bases of inherited disease. 8th ed. New York: McGraw Hill; 2001. 3733–3774
- Weidemann F, Sanchez-Niño MD, Politei J, Oliveira JP, Wanner C, Warnock DG, et al. (2013) Fibrosis: a key feature of Fabry disease with potential therapeutic implications. Orphanet J Rare Dis 8: 116. [View]
- Patel V, O’Mahony C, Hughes D, Rahman MS, Coats C, Murphy E, et al. (2015) Clinical and genetic predictors of major cardiac events in patients with Anderson-Fabry disease. Heart 101: 961–966. [View]
- Rombach SM, Smid BE, Linthorst GE, Dijkgraaf MG, Hollak CE (2014) Natural course of Fabry disease and the effectiveness of enzyme replacement therapy: a systematic review and meta-analysis: effectiveness of ERT in different disease stages. J Inherit Metab Dis 37: 341–352. [View]
- Linhart A, Palecek T, Bultas J, Ferguson JJ, Hrudova J, Karetova D, et al. (2000) New insights in cardiac structural changes in patients with Fabry’s disease. Am Heart J 139: 1101–1108. [View]
- Cocozza S, Russo C, Pontillo G, Pisani A, Brunetti A (2018) Neuroimaging in Fabry disease: current knowledge and future directions. Insights Imaging 9: 1077–1088. [View]
- Wardlaw JM, Smith EE, Biessels GJ, Cordonnier C, Fazekas F, Frayne R (2013) Standards for ReportIng Vascular changes on nEuroimaging (STRIVE v1). Neuroimaging standards for research into small vessel disease and its contribution to ageing and neuro-degeneration. Lancet Neurol 12: 822–838. [View]
- Kolodny E, Fellgiebel A, Hilz MJ, Sims K, Caruso P, Phan TG et al. (2015) Cerebrovascular involvement in Fabry disease: current status of knowledge. Stroke. 46: 302–313. [View]
- Fazekas F, Chawluk JB, Alavi A, Hurtig HI, Zimmerman RA (1987) MR signal abnormalities at 1.5 T in Alzheimer’s dementia and normal aging. AJR Am J Roentgenol 149: 351–356. [View]
- Lechner H, Schmidt R, Fazekas F, Koch M, Offenbacher H, Reinhart B, et al. (1994) White matter lesions on magnetic resonance imaging in a healthy elderly population: Correlations to vascular risk factors and carotid atherosclerosis. J Stroke Cerebrovasc Dis 4: 224–228. [View]
- Fazekas F, Barkhof F, Wahlund LO, Pantoni L, Erkinjuntti T, Scheltens P, et al. (2002) CT and MRI rating of white matter lesions. Cerebrovasc Dis 13 Suppl 2: 31–36. [View]
- Vianna-Pinton R, Moreno CA, Baxter CM, Lee KS, Tsang TS, Appleton CP. (2009) Two-dimensional speckle-tracking echocardiography of the left atrium: feasibility and regional contraction and relaxation differences in normal subjects. J Am Soc Echocardiogr 22: 299–305. [View]
- Sarvari SI, Haugaa KH, Stokke TM, Ansari HZ, Leren IS, Hegbom F, et al. (2016) Strain echocardiographic assessment of left atrial function predicts recurrence of atrial fibrillation. Eur Heart J Cardiovasc Imaging 17: 660–667. [View]
- Cameli M, Lisi M, Righini FM, Massoni A, Natali BM, Focardi M, et al. (2013) Usefulness of atrial deformation analysis to predict left atrial fibrosis and endocardial thickness in patients undergoing mitral valve operations for severe mitral regurgitation secondary to mitral valve prolapse. Am J Cardiol 111: 595–601. [View]
- Morris DA, Blaschke D, Canaan-Kühl S, Krebs A, Knobloch G, Walter TC, et al. (2015) Global cardiac alterations detected by speckle-tracking echocardiography in Fabry disease: left ventricular, right ventricular, and left atrial dysfunction are common and linked to worse symptomatic status. Int J Cardiovasc Imaging 31: 301–313. [View]
- Aerts JM, Groener JE, Kuiper S, Donker-Koopman WE, Strijland A, Ottenhoff R et al. (2008) Elevated globotriaosylsphingosine is a hallmark of Fabry disease. Proc Natl Acad Sci USA 105: 2812–2817. [View]
- Galderisi M, Cosyns B, Edvardsen T, Cardim N, Delgado V, Di Salvo G, et al. (2017) Standardization of adult transthoracic echocardiography reporting in agreement with recent chamber quantification, diastolic function, and heart valve disease recommendations: an expert consensus document of the European Association of Cardiovascular Imaging. Eur Heart J Cardiovasc Imaging 18: 1301–1310. [View]
- Lang RM, Badano LP, Mor-Avi V, Afilalo J, Armstrong A, Ernande, L et al. (2015) Recommendations for cardiac chamber quantification by echocardiography in adults: an update from the American Society of Echocardiography and the European Association of Cardiovascular Imaging. Eur Heart J Cardiovasc Imaging 16: 233–270. [View]
- de Simone G, Daniels SR, Devereux RB, Meyer RA, Roman MJ, de Divitiis O, et al. (1992) Left ventricular mass and body size in normotensive children and adults: assessment of allometric relations and impact of overweight. J Am Coll Cardiol 20: 251–260. [View]
- Nagueh SF, Smiseth OA, Appleton CP, Byrd BF 3rd, Dokainish H, Edvardsen T, et al. (2016) Recommendations for the evaluation of left ventricular diastolic function by Echocardiography: An update from the American Society of Echocardiography and the European Association of Cardiovascular Imaging. Eur Heart J Cardiovasc Imaging. 17: 1321–1360. [View]
- Rudski LG, Lai WW, Afilalo J, Hua L, Handschumacher MD, Chandrasekaran K et al. (2010) Guidelines for the echocardiographic assessment of the right heart in adults: a report from the American Society of Echocardiography. J Am SocEchocardiogr 23: 685–713. [View]
- Lembo M, Esposito R, Lo Iudice F, Santoro C, Izzo R, De Luca N, et al. (2016) Impact of pulse pressure on left ventricular global longitudinal strain in normotensive and newly diagnosed, untreated hypertensive patients. J Hypertens 34: 1201–1207. [View]
- Alcidi GM, Esposito R, Evola V, Santoro C, Lembo M, Sorrentino R, et al. (2018) Normal reference values of multilayer longitudinal strain according to age decades in a healthy population: A single-centre experience. Eur Heart J Cardiovasc Imaging 19: 1390–1396. [View]
- Mor-Avi V, Lang RM, Badano LP, Belohlavek M, Cardim NM, Derumeaux G, et al. (2011) Current and evolving echocardiographic techniques for the quantitative evaluation of cardiac mechanics: ASE/EAE consensus statement on methodology and indications endorsed by the Japanese Society of Echocardiography. J Am Soc Echocardiogr 24: 277–313. [View]
- Cameli M, Caputo M, Mondillo S, Ballo P, Palmerini E, Lisi M et al.(2009) Feasibility and reference values of left atrial longitudinal strain imaging by two-dimensional speckle tracking. Cardiovasc Ultrasound 7: 6.[View]
- Cameli M, Lisi M, Mondillo S, Padeletti M, Ballo P, Tsioulpas C, et al. (2010) Left atrial longitudinal strain by speckle tracking echocardiography correlates well with left ventricular filling pressures in patients with heart failure. Cardiovasc Ultrasound 8: 14.[View]
- Fazekas F, Enzinger C, Schmidt R, Grittner U, Giese AK, Hennerici MG, et al. (2015) Brain magnetic resonance imaging findings fail to suspect Fabry disease in young patients with an acute cerebrovascular event. Stroke 46:1548–1553. [View]
- Sugimoto T, Robinet S, Dulgheru R, Bernard A, Ilardi F, Contu L; (2018) NORRE Study. Echocardiographic reference ranges for normal left atrial function parameters: results from the EACVI NORRE study. Eur Heart J Cardiovasc Imaging 19: 630–638. [View]
- Mondillo S, Cameli M, Caputo ML, Lisi M, Palmerini E, Padeletti M et al. (2011) Early detection of left atrial strain abnormalities by speckle-tracking in hypertensive and diabetic patients with normal left atrial size. J Am Soc Echocardiogr 24: 898–908. [View]
- Boyd AC, Lo Q, Devine K, Tchan MC, Sillence DO, Sadick N et al. (2013) Left atrial enlargement and reduced atrial compliance occurs early in Fabry cardiomyopathy. J Am Soc Echocardiography 26:1415–1423. [View]
- Pichette M, Serri K, Pagè M, Zhao L, Bichet DG, Poulin F. (2017) Impaired left atrial function in Fabry disease: a longitudinal Speckle-Tracking Echocardiography study. J Am Soc Echocardiography 30: 170–179. [View]
- Putko BN, Yogasundaram H, Chow K, Pagano J, Khan A, Paterson DI, et al. (2015) Normal left-atrial structure and function despite concentric left-ventricular remodelling in a cohort of patients with Anderson-Fabry disease. Eur Heart J Cardiovasc Imaging 16: 1129–1136. [View]
- Kuppahally SS, Akoum N, Burgon NS, Badger TJ, Kholmovski EG, Vijayakumar S, et al. (2010) Left atrial strain and strain rate in patients with paroxysmal and persistent atrial fibrillation: relationship to left atrial structural remodeling detected by delayed-enhancement MRI. Circ Cardiovasc Imaging 3: 231–9. [View]
- Chimenti C, Russo MA, Frustaci A. (2010) A trial biopsy evidence of Fabry disease causing lone atrial fibrillation. Heart 96: 1782–1783. [View]
- Cocozza S, Olivo G, Riccio E, Russo C, Pontillo G, Ugga L, et al. (2017) Corpus callosum involvement: a useful clue for differentiating Fabry Disease from Multiple Sclerosis. Neuroradiology 59: 563–570. [View]
- Ugga L, Cocozza S, Pontillo G, Russo C, Brescia Morra V, Lanzillo R, et al. (2018) Absence of infratentorial lesions in Fabry disease contributes to differential diagnosis with multiple sclerosis. Brain Behav 8: e01121. [View]
- Liu D, Hu K, Schmidt M, Müntze J, Maniuc O, Gensler D, et al. (2018) Value of the CHA(2)DS(2)-VASc score and Fabry-specific score for predicting new-onset or recurrent stroke/TIA in Fabry disease patients without atrial fibrillation. Clin Res Cardiol 107: 1111–1121. [View]
- Segura T, Ayo-Martín O, Gómez-Fernandez I, Andrés C, Barba MA, Vivancos J. (2013) Cerebral hemodynamics and endothelial function in patients with Fabry disease. BMC Neurol 13: 170. [View]
- Schiffmann R, Warnock DG, Banikazemi M, Bultas J, Linthorst GE, Packman S, et al. (2009) Fabry disease: progression of nephropathy, and prevalence of cardiac and cerebrovascular events before enzyme replacement therapy. Nephrol Dial Transplant 24: 2102–2011. [View]
- Kaffashian S, Tzourio C, Zhu YC, Mazoyer B, Debette S. (2016) Differential effect of white-matter lesions and covert brain infarcts on the risk of ischemic stroke and intracerebral hemorrhage. Stroke 47: 1923–1925. [View]
- Ortiz A, Germain DP, Desnick RJ, Politei J, Mauer M, Burlina A, et al. (2018) Fabry disease revisited: Management and treatment recommendations for adult patients. Mol Genet Metab 123: 416–427. [View]
- Biegstraaten M, Arngrimsson R, Barbey F, Boks L, Cecchi F, Deegan PB, et al. (2015) Recommendations for initiation and cessation of enzyme replacement therapy in patients with Fabry disease: the European Fabry Working Group consensus document. Orphanet J Rare Dis 10: 36. [View]
- Fellgiebel A, Gartenschläger M, Wildberger K, Scheurich A, Desnick RJ, Sims K. (2014) Enzyme replacement therapy stabilized white matter lesion progression in Fabry disease. Cerebrovasc Dis 38: 448–56. [View]